skip navigation
Blog

Stay up to date on timely topics and market events. Subscribe to our Blog now.

MARKETS
01 April 2025

Weekly Municipal Monitor—Shift in Muni Debt Holders

By Sam Weitzman

Stay up to date on timely topics and market events. Subscribe to our Blog now.

Macros, Markets and Munis

Munis posted negative returns last week as the Treasury curve steepened, moving 2-4 basis points (bps) higher in shorter maturities and 4 bps higher in longer maturities. Financial markets were on edge throughout the week ahead of the Trump administration’s expected April 2 tariff deadline. Economic data came in weaker than expected as employment remained unchanged, but consumer confidence and sentiment indicators were reported below expectations. Core Personal Consumption Expenditures (PCE), the Federal Reserve’s (Fed) preferred inflation gauge, also moved higher to 2.8%. Meanwhile, municipals sold off across the yield curve and underperformed amid weaker technical conditions as mutual funds posted outflows for a third straight week. This week we highlight the shifts in municipal demand observed in 2024.

Elevated Supply and Fund Outflows Challenged Technicals

Fund Flows (down $573 million): During the week ending March 26, weekly reporting municipal mutual funds recorded $573 million of net outflows, according to Lipper. Long-term funds recorded $383 million of outflows, intermediate funds recorded $34 million of outflows and high-yield funds recorded $148 million of inflows. Last week’s outflows marked a third consecutive week of net outflows amid the seasonal tax-season weakness and led year-to-date (YTD) inflows lower to $10 billion.

Supply (YTD supply of $122 billion; up 36% YoY): The muni market recorded $9 billion of new-issue supply last week, down 17% from the prior week. YTD, the muni market has recorded $122 billion of new issuance, up 34% year-over-year (YoY). Tax-exempt and taxable issuance are up 36% and 44%, respectively, though tax-exempt issuance has comprised the vast majority (94%) of YTD supply. This week’s calendar is expected to increase to $12 billion. The largest deals include $1.3 billion state of California general obligation and $600 million University of Southern California transactions.

This Week in Munis: Shift in Muni Debt Holders

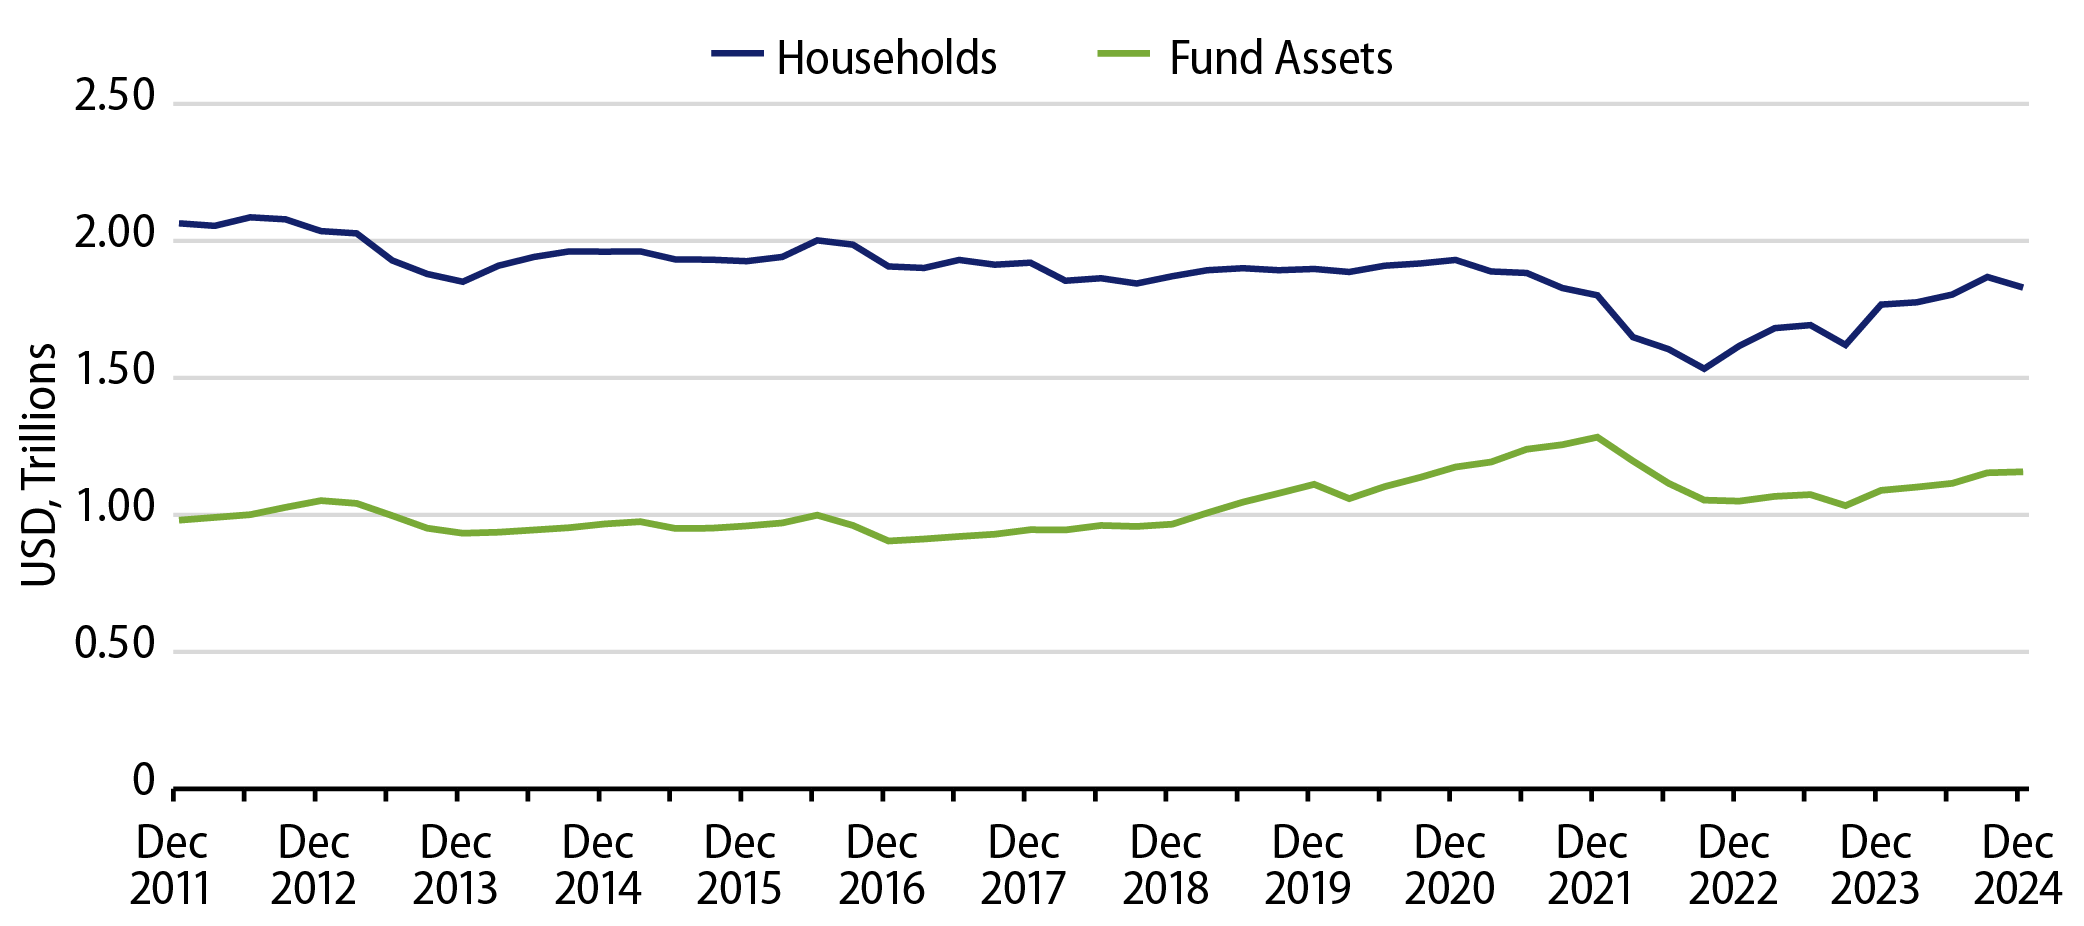
Earlier this month, the Fed released its updated Flow of Funds data, highlighting the primary holders of municipal debt through the end of 2024. According to the data, throughout the year municipal holdings continued to grow among retail individual holders, while holdings among major institutional holders (banks and insurance companies) declined.

Exhibit 1: Outstanding Muni Debt by Holders
Outstanding Muni Debt by Holders
Source: Federal Reserve, Western Asset. As of 13 Mar 25. Select the image to expand the view.

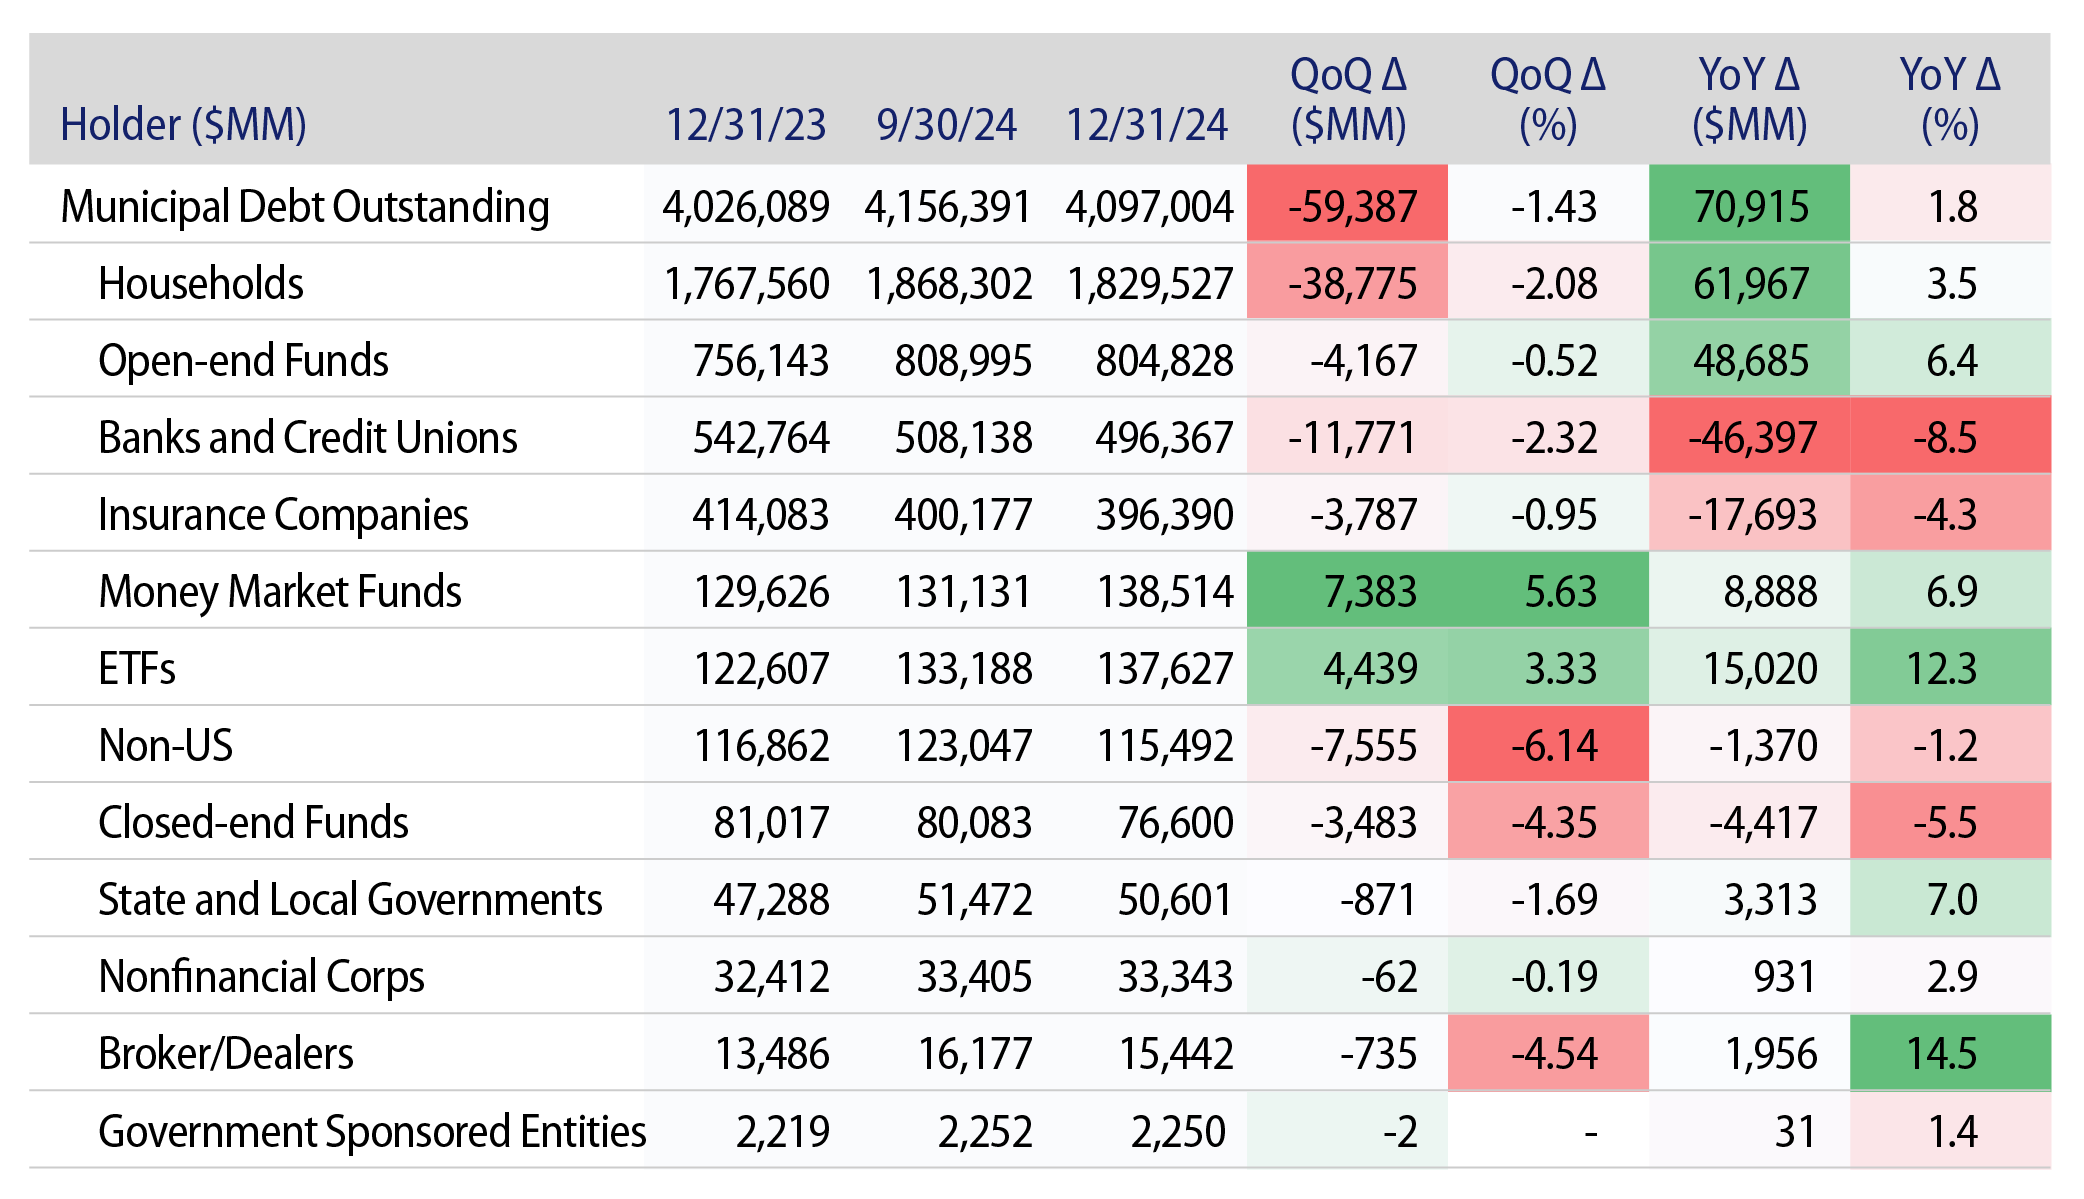
The municipal holdings data indicated $131 billion (+4.6%) growth across fund and separately managed account (SMA) vehicles in 2024. Total household holdings, a proxy for SMA demand, increased by $62 billion (+3.5%) during the year as the SMA vehicle remained an attractive solution for investors seeking customized objectives within a muni allocation. Municipal fund assets increased $68 billion (+6.3%) during the year. Open-end funds, ETFs and money market funds increased $49 billion (6.4%), $15 billion (12.3%) and $9 billion (6.9%) during the year, respectively.

Exhibit 2: Households and Muni Fund Assets
Households and Muni Fund Assets
Source: Federal Reserve, Western Asset. As of 13 Mar 25. Select the image to expand the view.

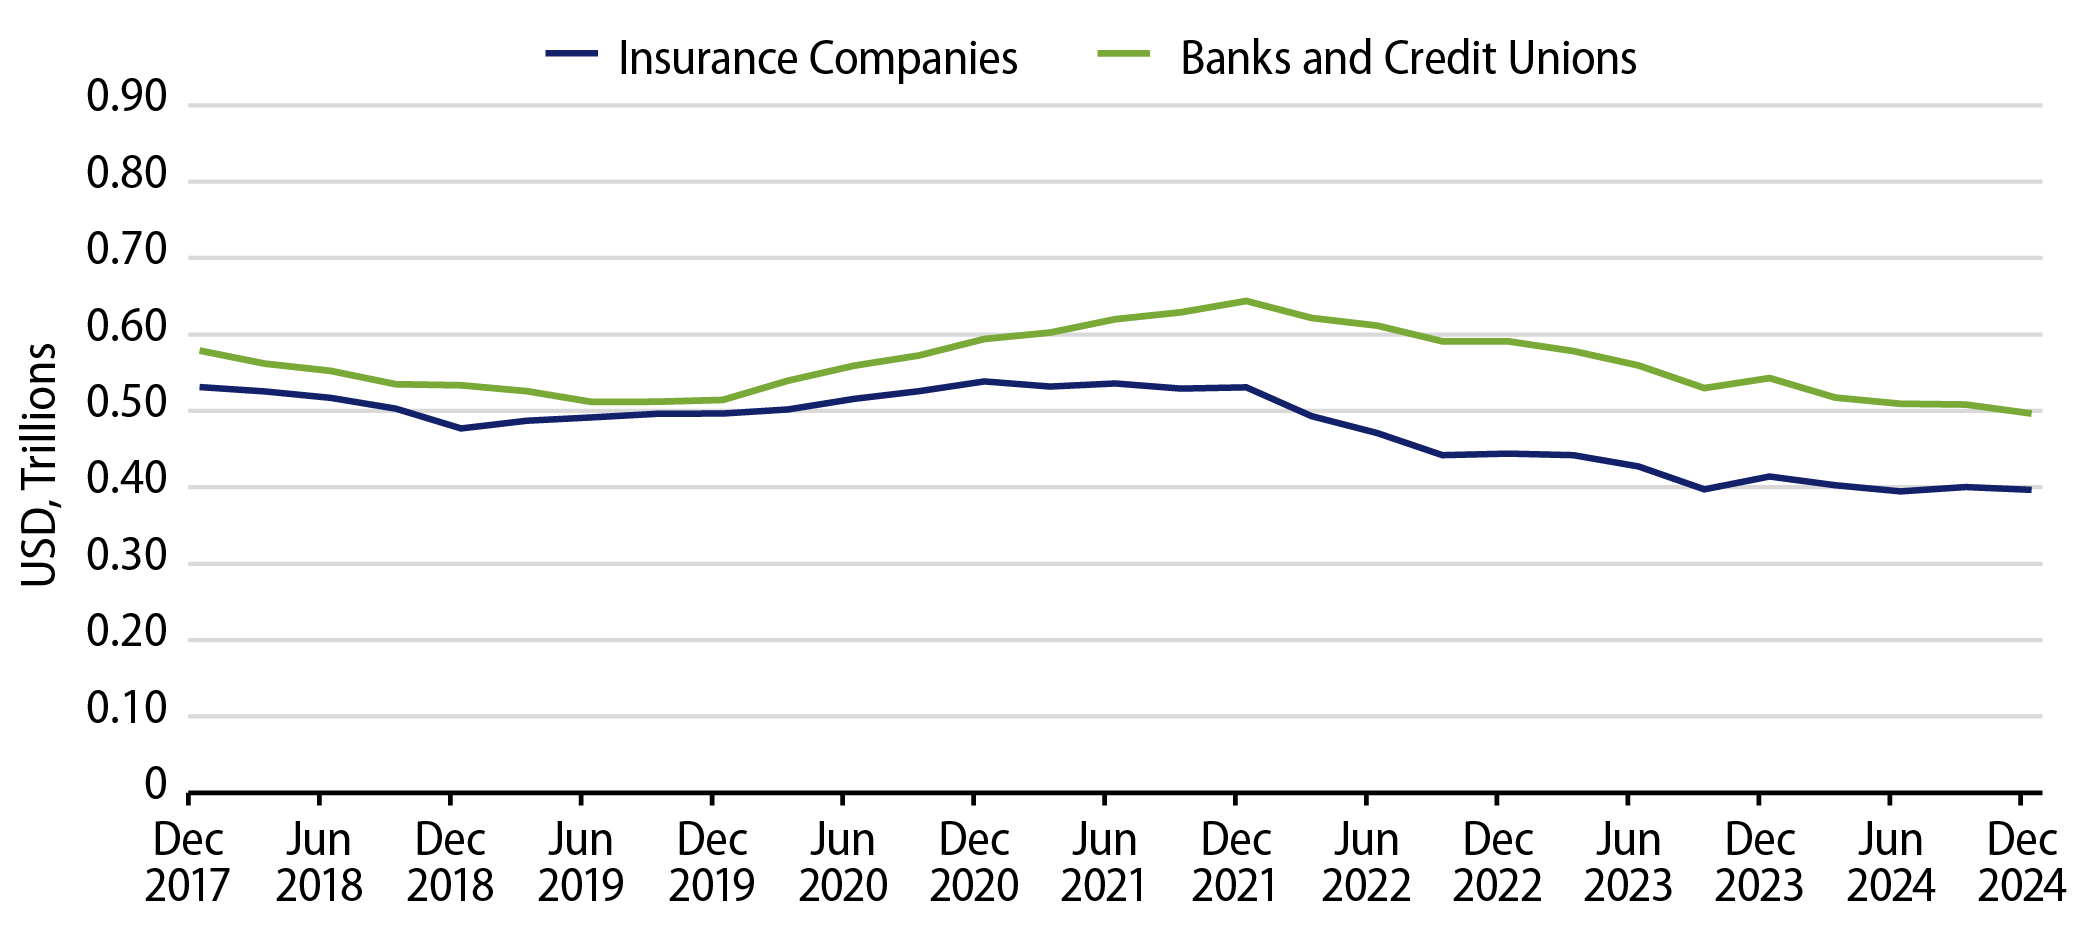
Institutional holdings of municipal debt declined $64 billion (-6.7%) during the year, attributable to lower corporate tax rates, increased tender/call activity of taxable municipal debt and bank balance sheet de-risking of longer-duration municipal assets. Insurance company holdings of municipals declined by $17 billion (-9%) in 2024. Bank municipal holdings decreased by $46 billion (-9%) during the year. Non-US demand for taxable municipals also declined 1% in 2024.

Exhibit 3: Institutional Muni Holders (Insurance Companies and Banks)
Institutional Muni Holders (Insurance Companies and Banks)
Source: Federal Reserve, Western Asset. As of 13 Mar 25. Select the image to expand the view.

The Fed data underscored the growth of the overall municipal asset class last year, as well as the increasing demand from individual investors subject to higher tax rates. However, institutions stepped away as marginal buyers of traditional tax-exempt municipals, leading to a higher concentration of traditional retail individual investors within the market. Western Asset believes that the less diversified demand base of the muni market could contribute to volatility but also create opportunities for an active manager in these uncertain market conditions.

Municipal Credit Curves and Relative Value

Exhibit 4: Muni Credit Curves
Muni Credit Curves
Source: Bloomberg, Western Asset. As of 28 Mar 25. Bloomberg Valuation Service (BVAL) Municipal Credit Indices (AAA, AA, A, BBB, respectively) and US Sovereign Curves. Taxable-Equivalent Muni Credit Curves consider the top marginal effective tax rate of 40.8%. AA Muni is represented by the US General Obligation AA Muni BVAL Yield Curve. The BVAL curve is populated with pricing from uninsured AA General Obligation bonds. A Muni is represented by the US General Obligation A Muni BVAL Yield Curve. The BVAL curve is populated with pricing from uninsured A General Obligation bonds. BBB Muni is represented by the US General Obligation BBB Muni BVAL Yield Curve. The BVAL curve is populated with pricing from uninsured BBB General Obligation bonds. Indices are unmanaged and one cannot directly invest in them. They do not include fees, expenses or sales charges. Past performance is not an indicator or a guarantee of future results. Select the image to expand the view.
Exhibit 5: Taxable-Equivalent Muni Credit Curves
Taxable-Equivalent Muni Credit Curves
Source: Bloomberg, Western Asset. As of 28 Mar 25. Bloomberg Valuation Service (BVAL) Municipal Credit Indices (AAA, AA, A, BBB, respectively) and US Sovereign Curves. Taxable-Equivalent Muni Credit Curves consider the top marginal effective tax rate of 40.8%. AA Muni is represented by the US General Obligation AA Muni BVAL Yield Curve. The BVAL curve is populated with pricing from uninsured AA General Obligation bonds. A Muni is represented by the US General Obligation A Muni BVAL Yield Curve. The BVAL curve is populated with pricing from uninsured A General Obligation bonds. BBB Muni is represented by the US General Obligation BBB Muni BVAL Yield Curve. The BVAL curve is populated with pricing from uninsured BBB General Obligation bonds. Indices are unmanaged and one cannot directly invest in them. They do not include fees, expenses or sales charges. Past performance is not an indicator or a guarantee of future results. Select the image to expand the view.
Exhibit 6: AAA Munis vs. Treasuries
AAA Munis vs. Treasuries
Source: Muni Yields: Thomson Reuters MMD, Treasury Yields: Bloomberg. As of 28 Mar 25. Past performance is not a guarantee of future results. It is not possible to invest directly in an index. Select the image to expand the view.
Exhibit 7: Tax-Exempt and Taxable Muni Valuations
Tax-Exempt and Taxable Muni Valuations
Source: Bloomberg, Western Asset. As of 28 Mar 25. Yield-to-worst (YTW) is the lowest potential yield that can be received on a bond without the issuer actually defaulting. AAA, AA, A, BBB Corporate Indices; After-Tax Yield assumes a top effective tax rate of 40.8%. Taxable Muni Index Corporate comparable used is the Global Corporate Aggregate (ex. BBB) to better align credit quality and duration. Select the image to expand the view.

Western Asset Key Themes for Muni Investors

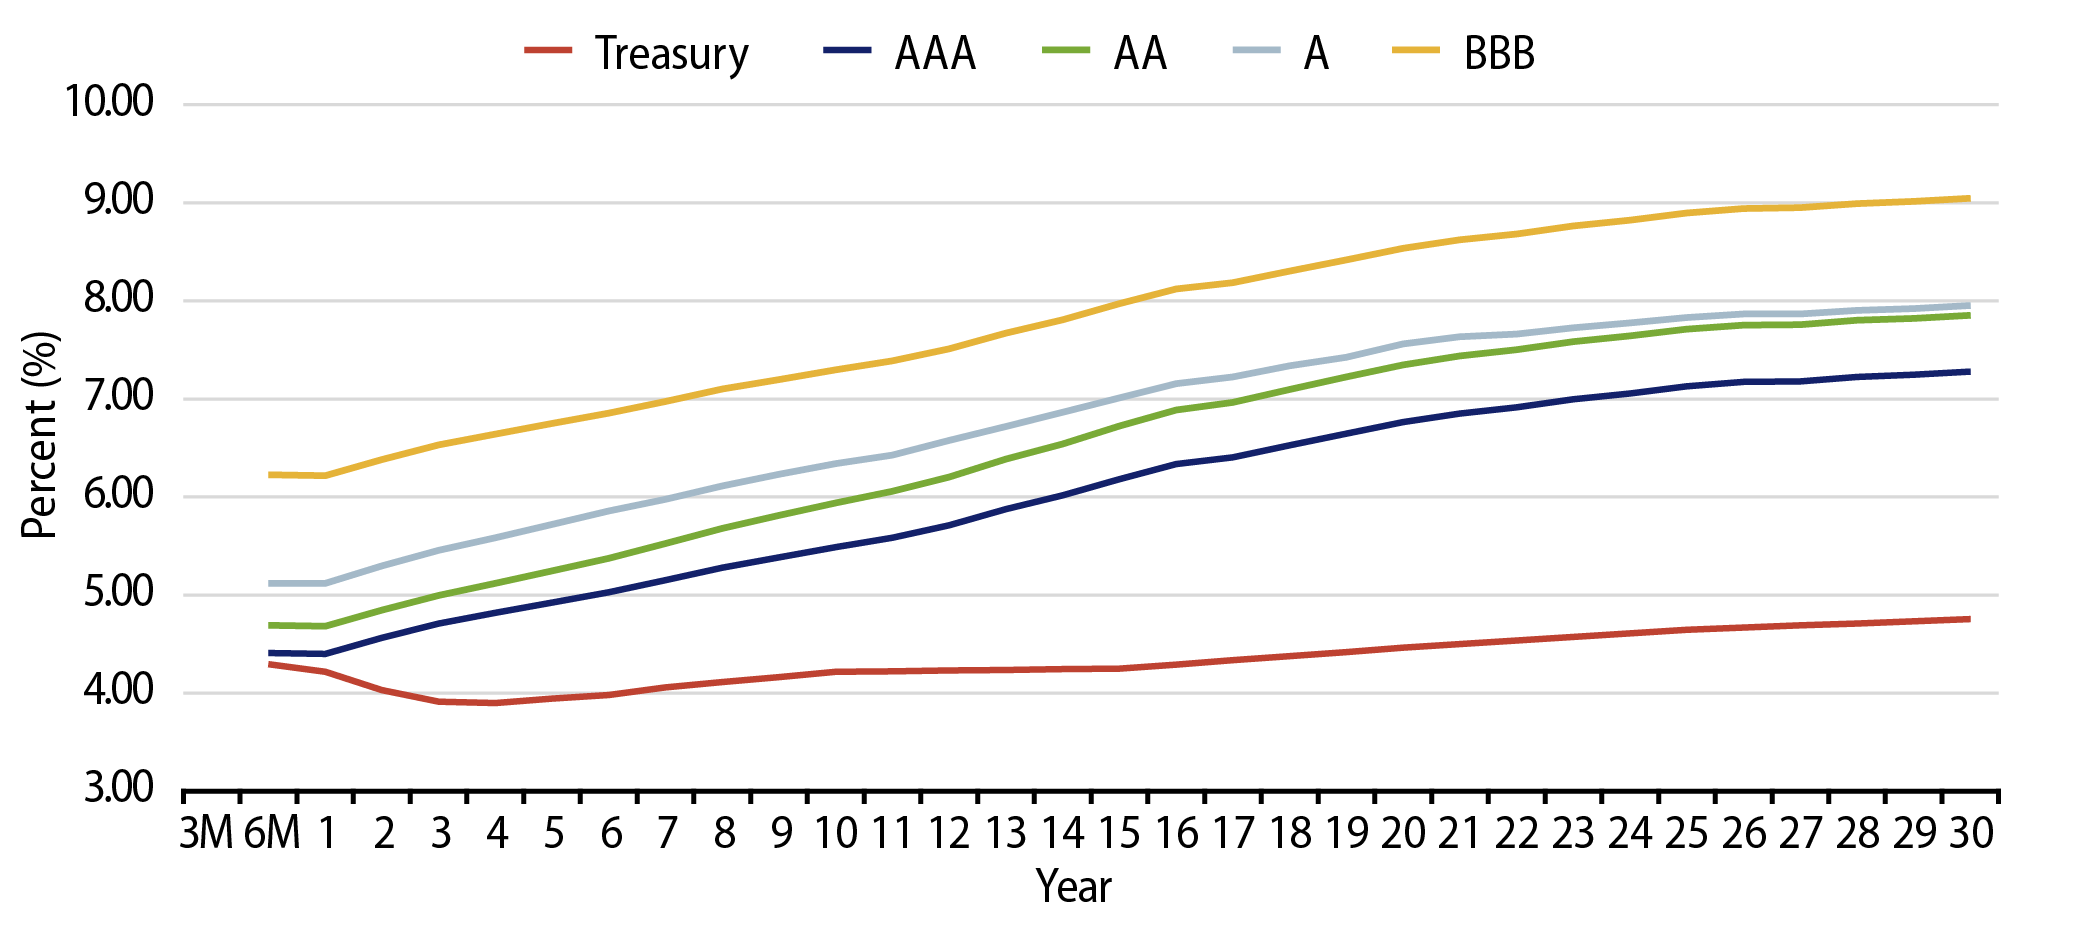
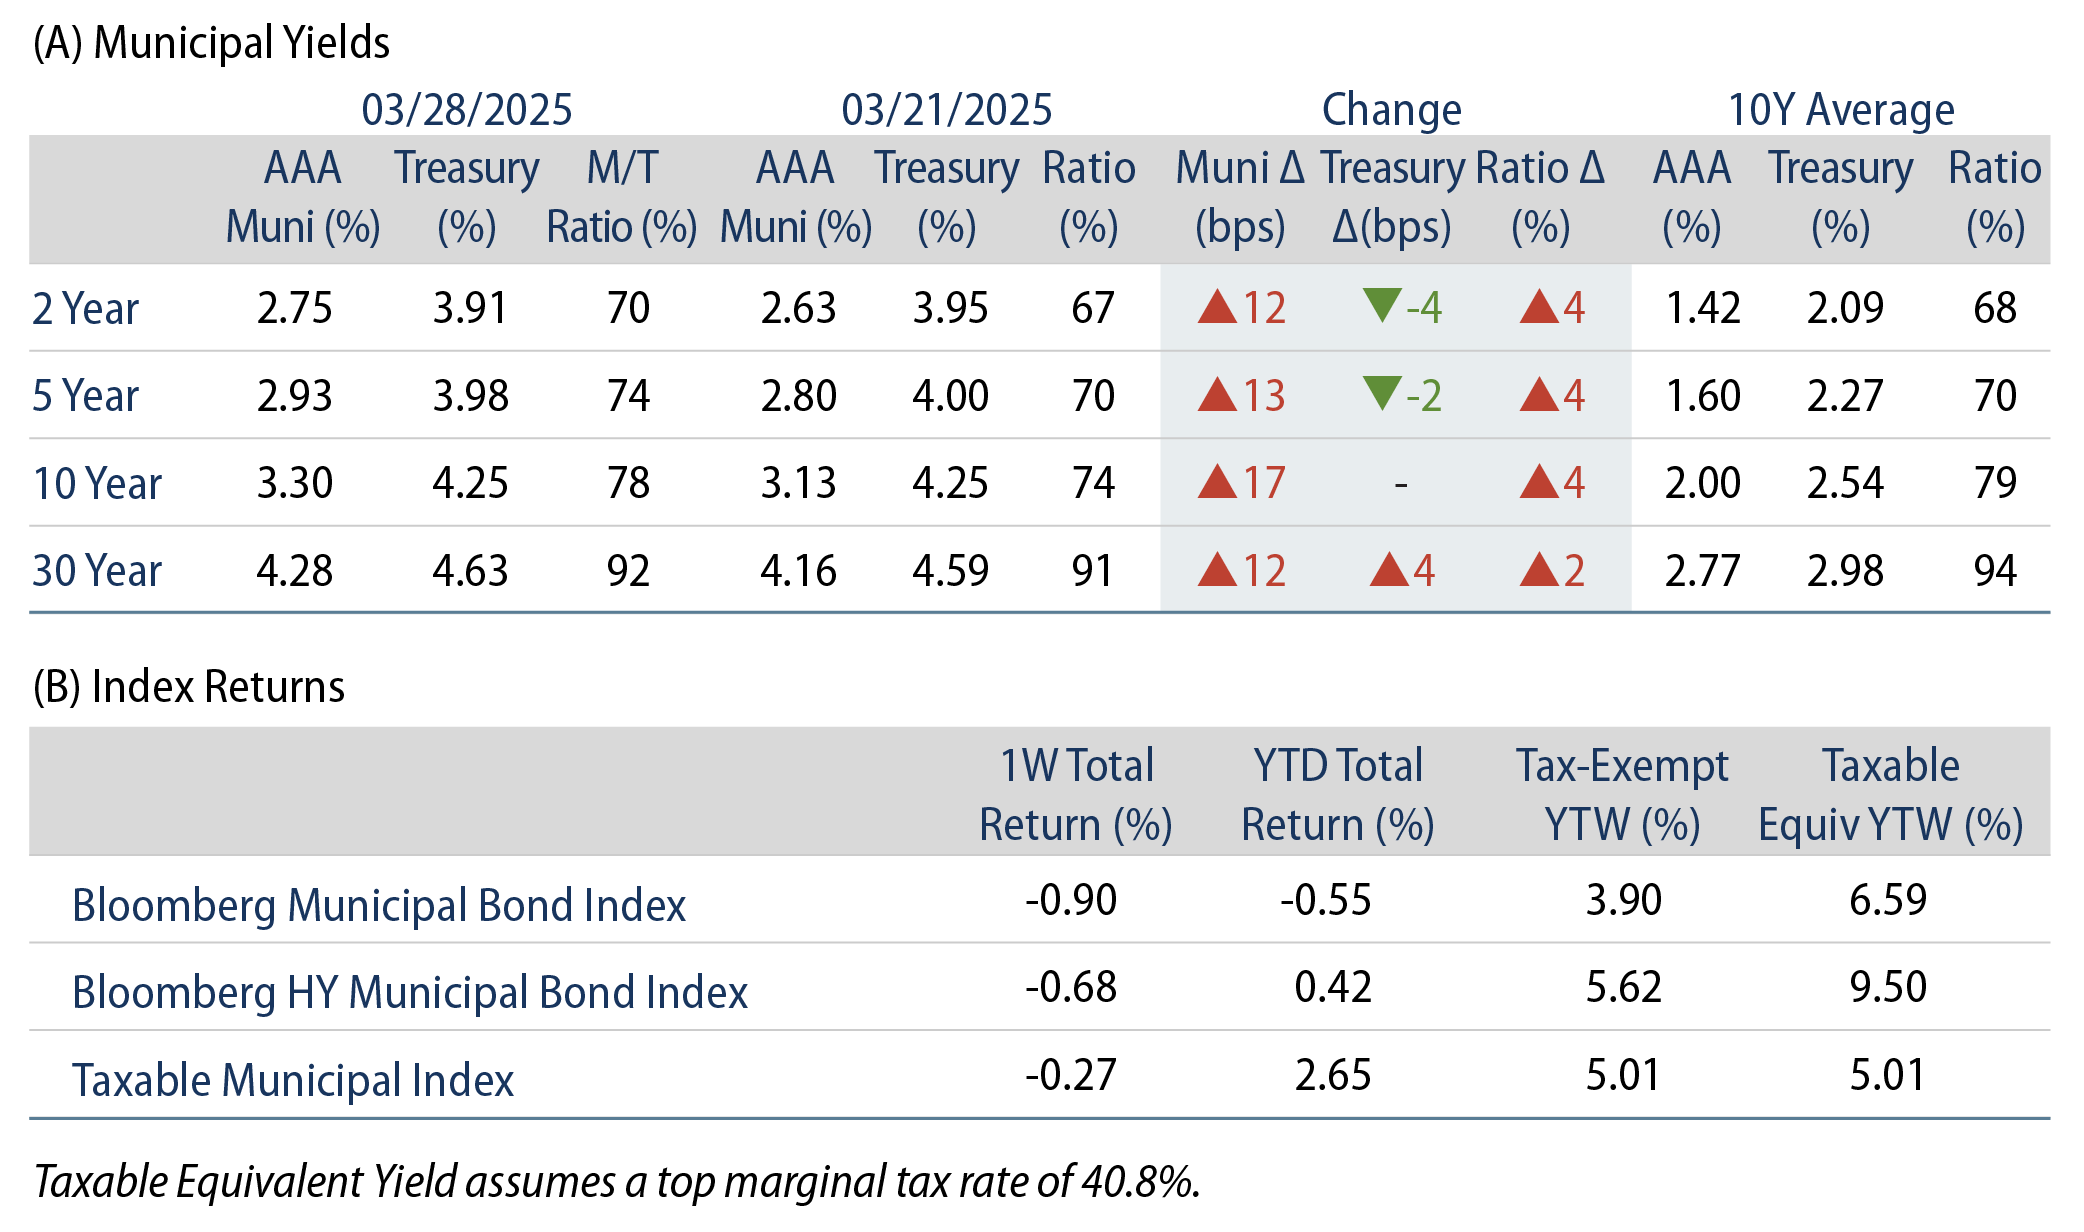
Theme #1: Municipal taxable-equivalent yields and income opportunities remain above decade averages.

Exhibit 8: Muni and Taxable-Equivalent Muni Yield-to-Worst
Muni and Taxable-Equivalent Muni Yield-to-Worst
Source: Bloomberg, Western Asset. As of 28 Mar 25. Bloomberg Municipal Bond Index yield considering highest marginal tax rate of 40.8%. Indexes are unmanaged and one cannot directly invest in them. They do not include fees, expenses or sales charges. Past performance is not an indicator or a guarantee of future results. Select the image to expand the view.

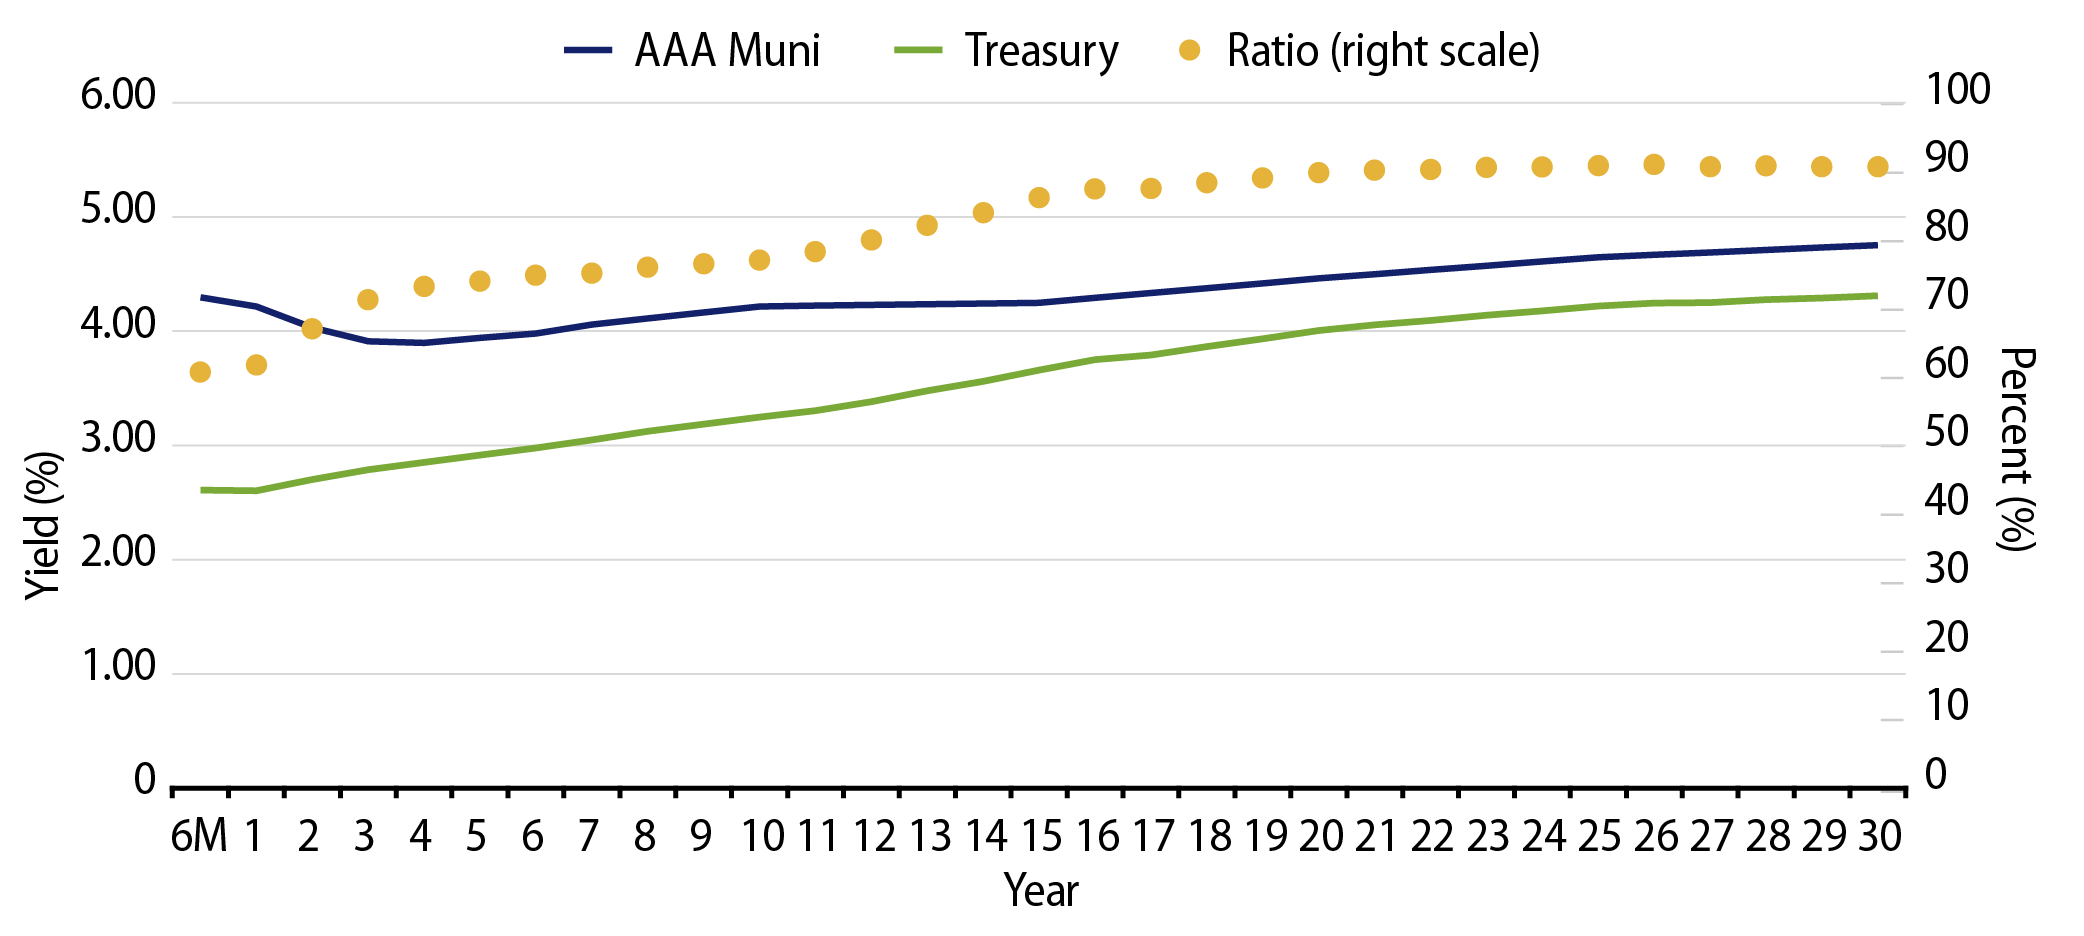
Theme #2: The muni curve has steepened, offering better value in intermediate and longer maturities.

Exhibit 9: AAA Municipal vs. Treasury Yield Curves
AAA Municipal vs. Treasury Yield Curves
Source: Bloomberg, Western Asset. As of 28 Mar 25. Bloomberg Valuation Service (BVAL) AAA Muni Curve and US On-/Off-the-Run Sovereign Curve. Indexes are unmanaged and one cannot directly invest in them. They do not include fees, expenses or sales charges. Past performance is not an indicator or a guarantee of future results. Select the image to expand the view.

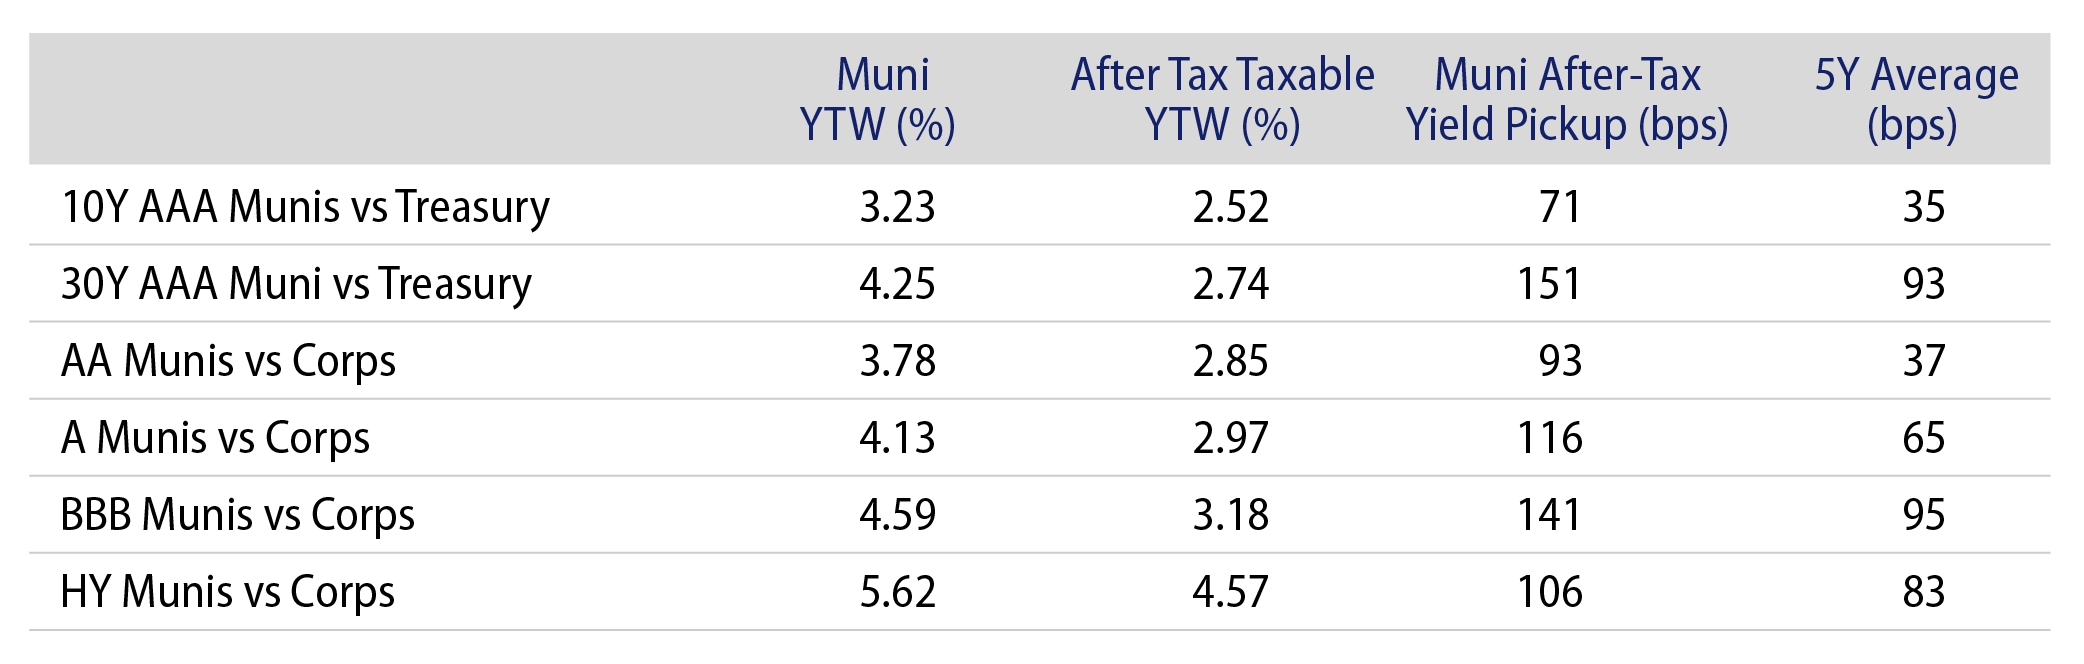
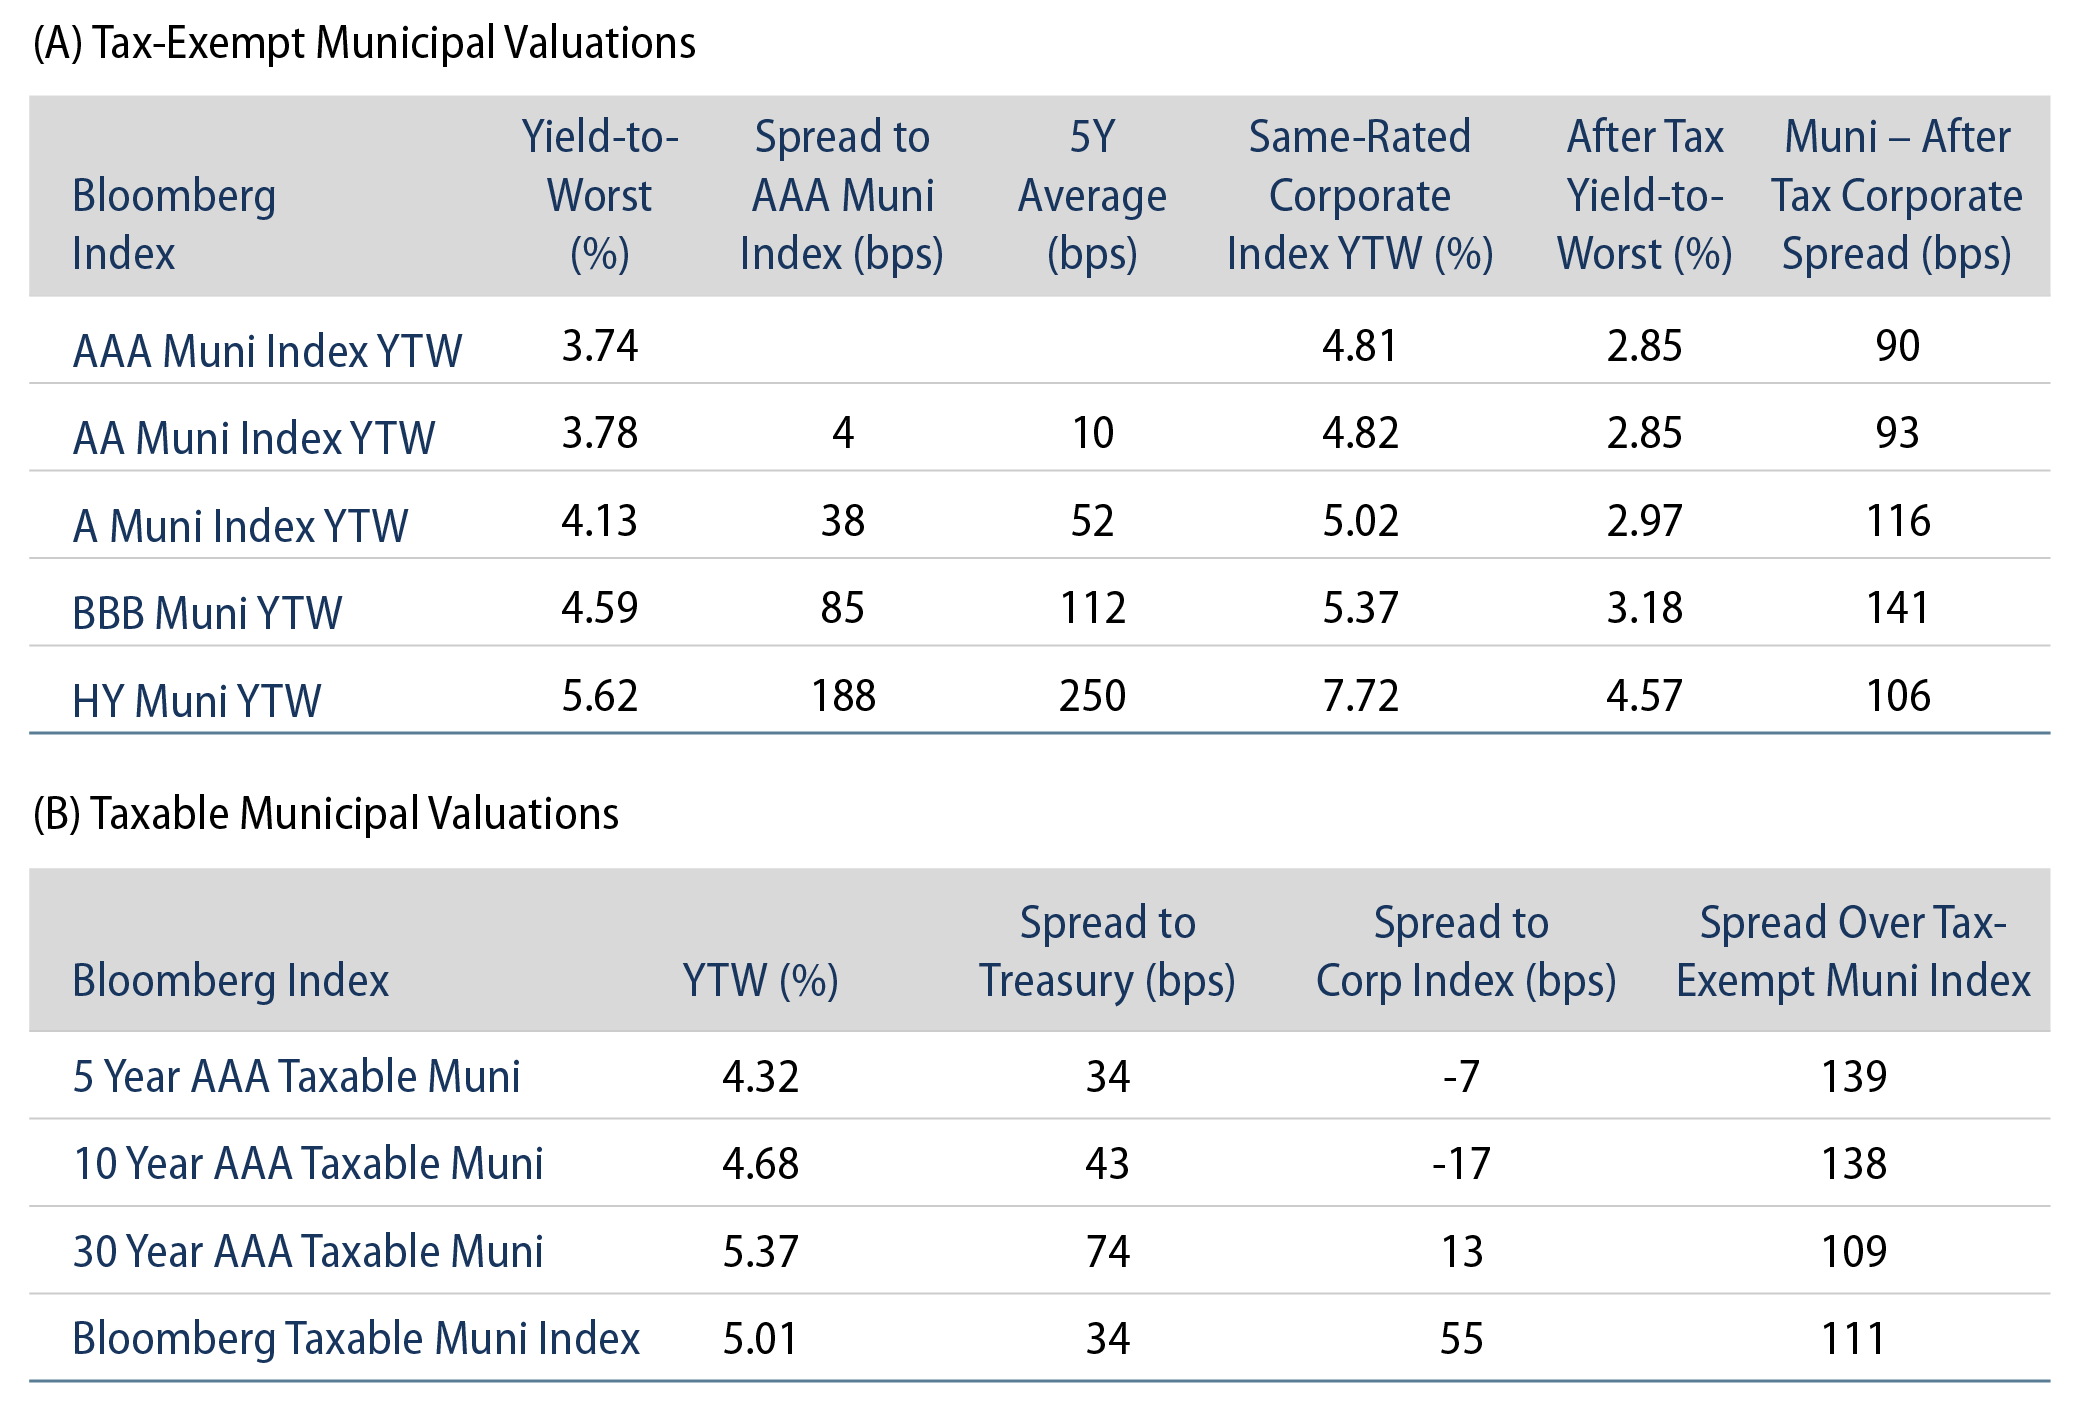
Theme #3: Munis offer attractive after-tax yield pickup versus longer-dated Treasuries and investment-grade corporate credit.

Exhibit 10: Municipal vs. Taxable Fixed-Income Yields by Quality
Municipal vs. Taxable Fixed-Income Yields by Quality
Source: Western Asset, Bloomberg. As 28 Mar 25. 10- and 30-Year comparison reflects Bloomberg Valuation Service (BVAL) AAA Muni Curve and US On-/Off-the-Run Sovereign Curve. AA Muni reflects the Bloomberg AA Muni Bond Index. A Muni reflects the Bloomberg A Muni Bond Index. BBB Muni reflects the Bloomberg BBB Muni Bond Index. HY Muni reflects the Bloomberg High Yield Muni Bond Index. AA Corp reflects the Bloomberg AA Corporate Bond Index. A Corp reflects the Bloomberg A Corporate Bond Index. BBB Corp reflects the Bloomberg BBB Corporate Bond Index. After-tax yield considers top marginal tax rate of 40.8%. Indexes are unmanaged and one cannot directly invest in them. They do not include fees, expenses or sales charges. Past performance is not an indicator or a guarantee of future results. Select the image to expand the view.

© Western Asset Management Company, LLC 2025. The information contained in these materials ("the materials") is intended for the exclusive use of the designated recipient ("the recipient"). This information is proprietary and confidential and may contain commercially sensitive information, and may not be copied, reproduced or republished, in whole or in part, without the prior written consent of Western Asset Management Company ("Western Asset").
Past performance does not predict future returns. These materials should not be deemed to be a prediction or projection of future performance. These materials are intended for investment professionals including professional clients, eligible counterparties, and qualified investors only.
These materials have been produced for illustrative and informational purposes only. These materials contain Western Asset's opinions and beliefs as of the date designated on the materials; these views are subject to change and may not reflect real-time market developments and investment views.
Third party data may be used throughout the materials, and this data is believed to be accurate to the best of Western Asset's knowledge at the time of publication, but cannot be guaranteed. These materials may also contain strategy or product awards or rankings from independent third parties or industry publications which are based on unbiased quantitative and/or qualitative information determined independently by each third party or publication. In some cases, Western Asset may subscribe to these third party's standard industry services or publications. These standard subscriptions and services are available to all asset managers and do not influence rankings or awards in any way.
Investment strategies or products discussed herein may involve a high degree of risk, including the loss of some or all capital. Investments in any products or strategies described in these materials may be volatile, and investors should have the financial ability and willingness to accept such risks.
Unless otherwise noted, investment performance contained in these materials is reflective of a strategy composite. All other strategy data and information included in these materials reflects a representative portfolio which is an account in the composite that Western Asset believes most closely reflects the current portfolio management style of the strategy. Performance is not a consideration in the selection of the representative portfolio. The characteristics of the representative portfolio shown may differ from other accounts in the composite. Information regarding the representative portfolio and the other accounts in the composite are available upon request. Statements in these materials should not be considered investment advice. References, either general or specific, to securities and/or issuers in the materials are for illustrative purposes only and are not intended to be, and should not be interpreted as, recommendation to purchase or sell such securities. Employees and/or clients of Western Asset may have a position in the securities or issuers mentioned.
These materials are not intended to provide, and should not be relied on for, accounting, legal, tax, investment or other advice. The recipient should consult its own counsel, accountant, investment, tax, and any other advisers for this advice, including economic risks and merits, related to making an investment with Western Asset. The recipient is responsible for observing the applicable laws and regulations of their country of residence.
Founded in 1971, Western Asset Management Company is a global fixed-income investment manager with offices in Pasadena, New York, London, Singapore, Tokyo, Melbourne, São Paulo, Hong Kong, and Zürich. Western Asset is a wholly owned subsidiary of Franklin Resources, Inc. but operates autonomously. Western Asset is comprised of six legal entities across the globe, each with distinct regional registrations: Western Asset Management Company, LLC, a registered Investment Adviser with the Securities and Exchange Commission; Western Asset Management Company Ltda. is regulated by Comissão de Valores Mobiliários; Western Asset Management Company Pty Ltd ABN 41 117 767 923 is the holder of the Australian Financial Services License 303160; Western Asset Management Company Pte. Ltd. Co. Reg. No. 200007692R is a holder of a Capital Markets Services License for fund management and regulated by the Monetary Authority of Singapore; Western Asset Management Company Ltd, a registered Financial Instruments Business Operator and regulated by the Financial Services Agency of Japan; and Western Asset Management Company Limited is authorised and regulated by the Financial Conduct Authority ("FCA") (FRN 145930). This communication is intended for distribution to Professional Clients only if deemed to be a financial promotion in the UK as defined by the FCA. This communication may also be intended for certain EEA countries where Western Asset has been granted permission to do so. For the current list of the approved EEA countries please contact Western Asset at +44 (0)20 7422 3000.