

IG Spreads
The Bloomberg US Credit Index option-adjusted spread (OAS) widened by 8 basis points (bps) to +96 bps on April 3, the day after the tariffs were announced. Investment-grade (IG) Index spreads approached +150 bps back in 2018/2019 (Exhibit 1).

While 8 bps of spread widening is the largest one-day move since the Spring 2023 banking crisis, it’s a measured response considering that domestic equities were down approximately 5% (the largest downdraft since Covid) and 5- and 10-year US Treasury yields fell by 22 and 16 bps, respectively.
Spreads in cyclical industries reacted the most negatively, but the worst-performing IG subsectors yesterday were not the headline sectors with large equity downdrafts picked up by the media (e.g., tech and retail). From an excess-return perspective, the worst-performing subsectors were cable/satellite (-95 bps), railroads (-87 bps) and energy (-85 bps). Cable and railroads are longer-duration industries (9.4 and 10.9 years, respectively, compared to 6.8 years for the overall US Credit Index), while energy taking a hit is understandable given heightened recession fears and oil collapsing toward $60/bbl after largely trading in the $70-$90/bbl corridor for the last three years.
What’s Next?
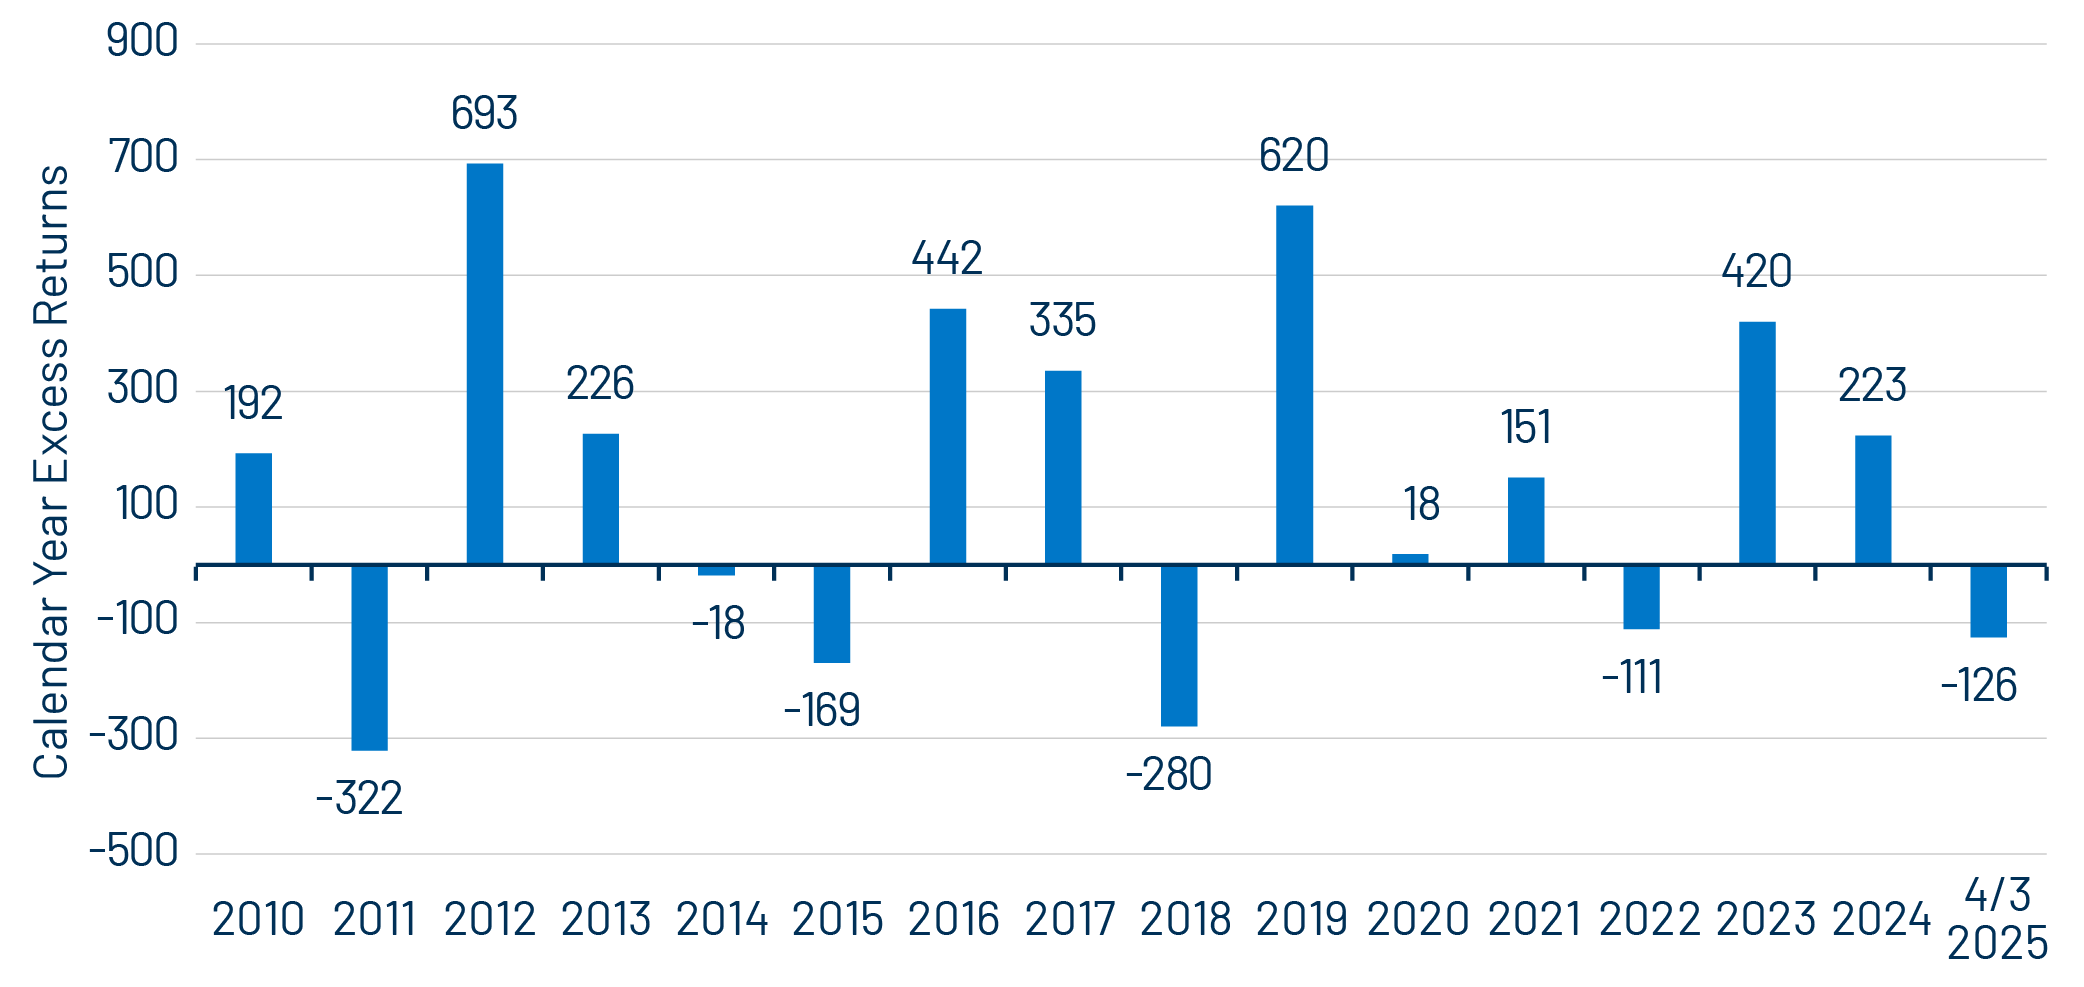
To state the obvious, it’s likely going to get worse before it gets better. The Trump administration is clearly willing to take more pain in the markets as it seeks to reorient global trade. China announced retaliatory tariffs overnight, and domestic equities were down another 5%-6% on Friday April 4. The flight to quality continues with Treasury yields lower by another 10-15 bps earlier in the day. Yesterday’s 8-bp decline translated to -59 bps of excess returns in one day (bringing year-to-date excess returns to -126 bps). Spread widening in 2018 led to -280 bps of excess returns, so we’re less than halfway to that marker.
However, compared to the 2018 episode, there are some differences in the market backdrop. The breadth, depth and immediacy of the tariff announcements are loftier this time around. Here are some other stark differences between then and now:
- The Federal Reserve (Fed) was in the midst of a hiking cycle back in 2018 rather than today’s easing bias, although Fed Chair Jerome Powell just announced in a speech this morning that he expects the Federal Open Market Committee to be on hold: “We are well positioned to wait for greater clarity before considering any adjustments to our policy stance. It is too soon to say what will be the appropriate path for monetary policy.” Markets, however, are pricing in four cuts by the end of 2025.
- Global growth decelerated in 2018: Germany, China and Japan unexpectedly cooled when market consensus was for a continuation of global synchronized growth in early 2018. This time, Europe and China are enacting policies to stimulate their economies.
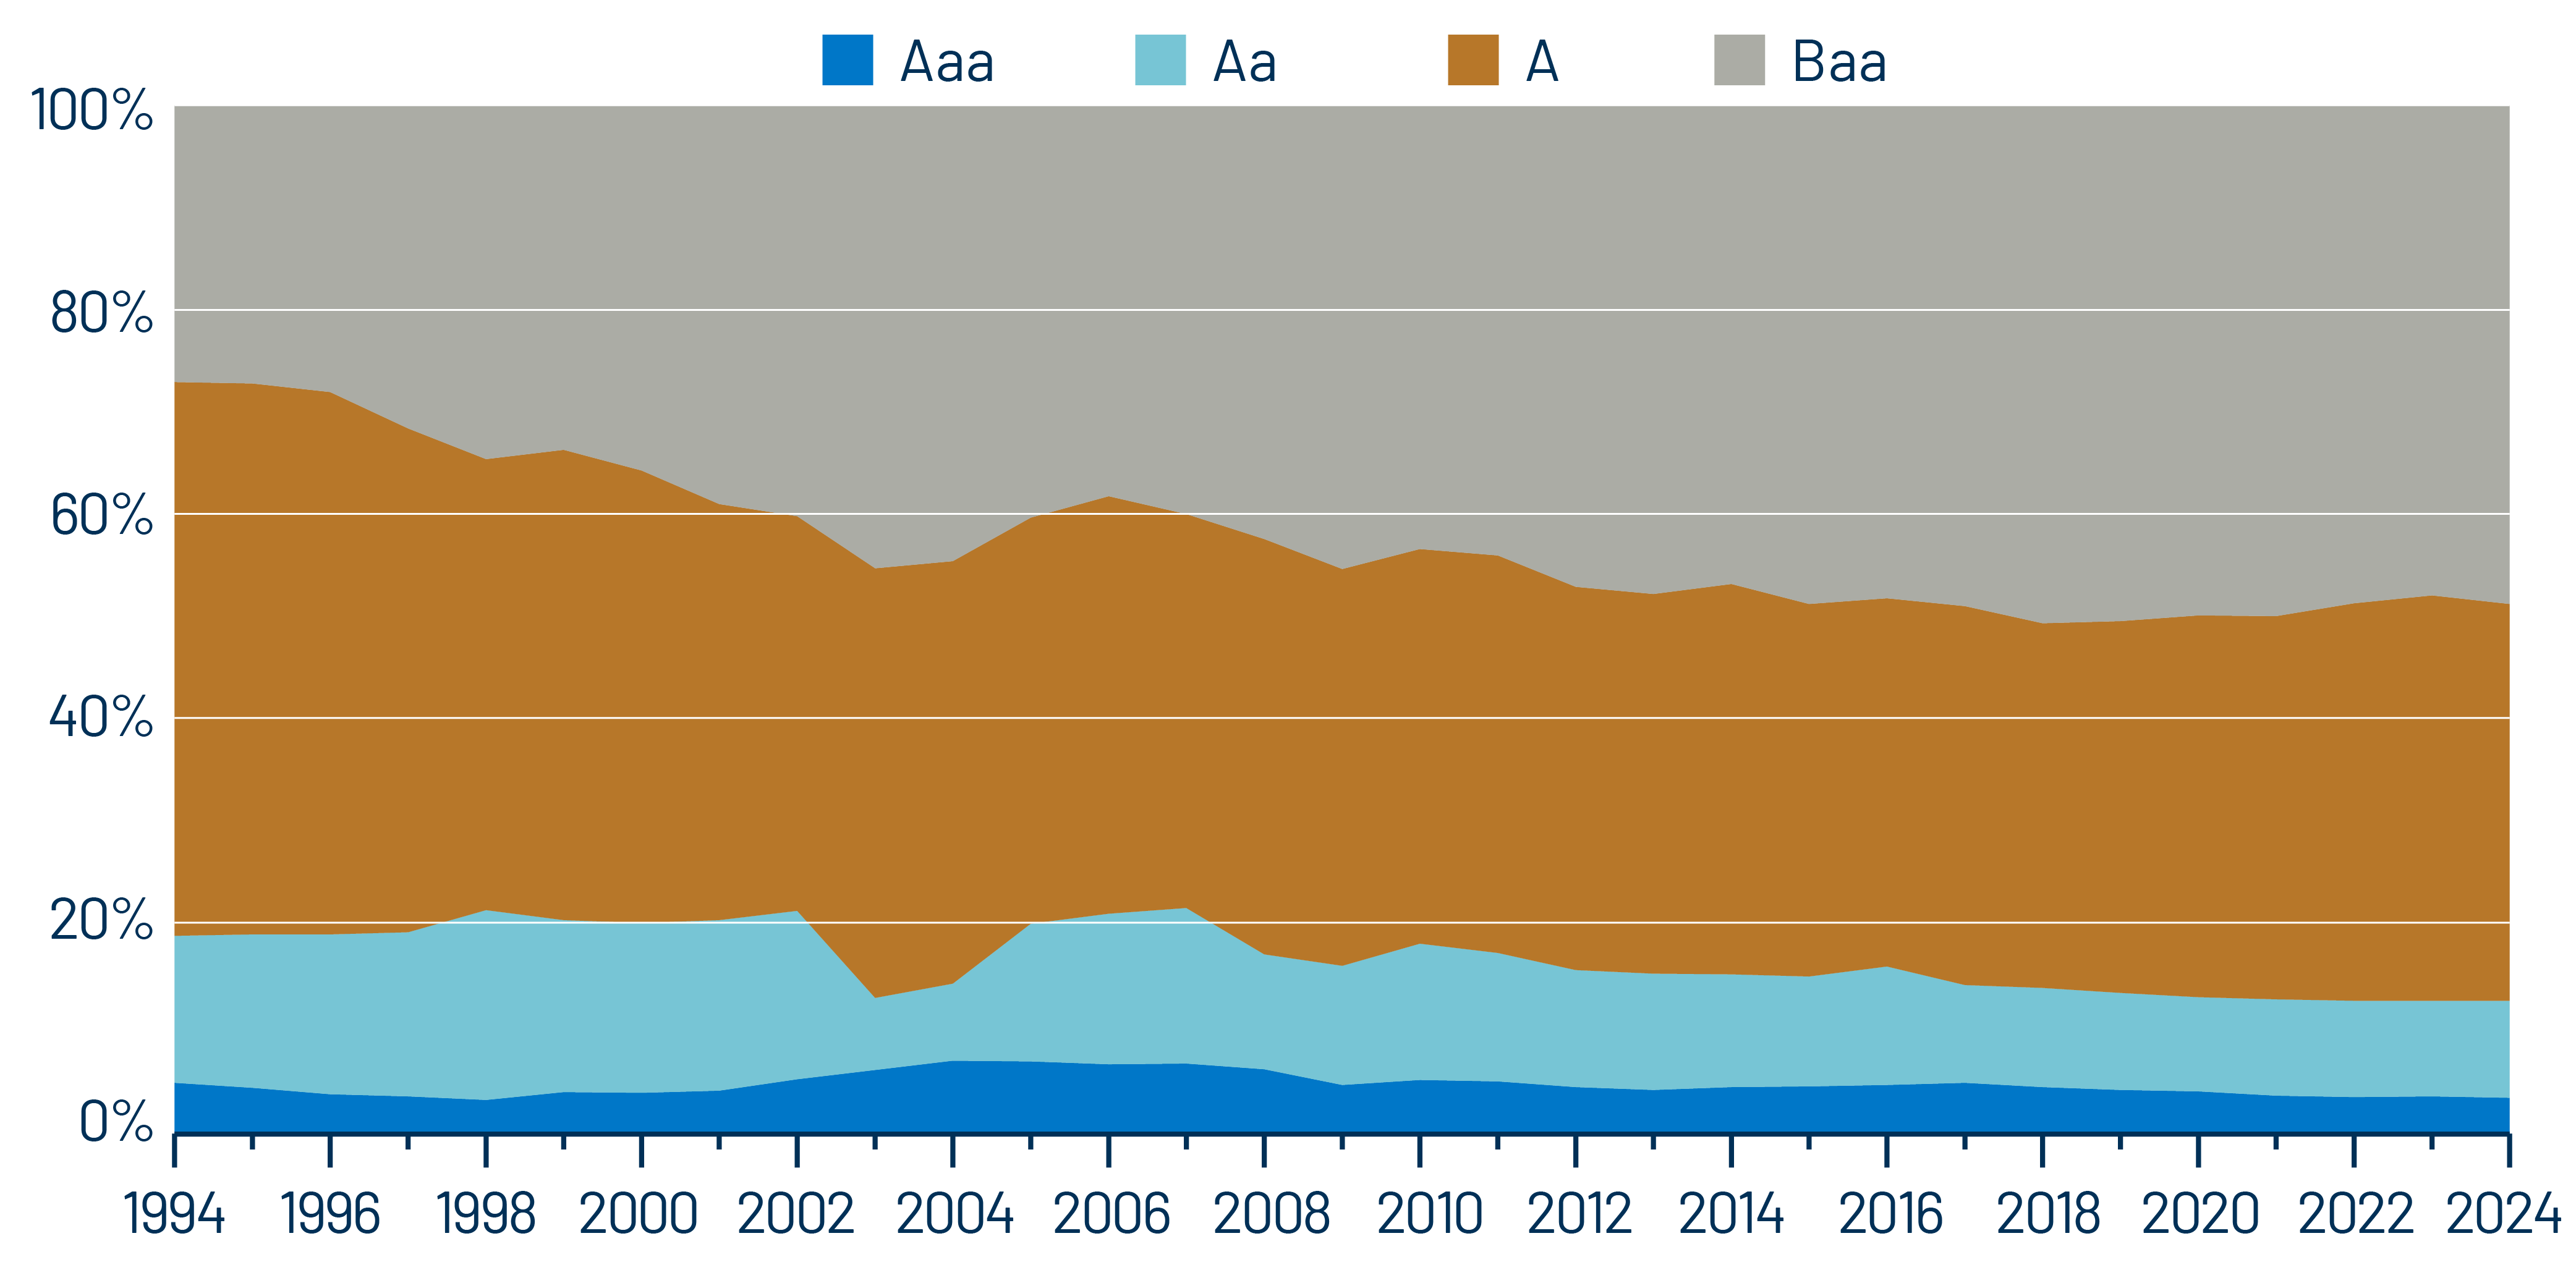
- Recessions are meant to correct excesses, and the domestic excesses in the US since the height of the pandemic have been on the fiscal side (though it’s unclear what the downstream effects will be of fiscal austerity today). That said, a major worry in 2018 was about the leverage build-up in the corporate space and the “wall of BBBs” that were feared to become fallen angels. BBBs peaked as a share of the IG market back then, but corporates have behaved conservatively since the pandemic era. The balance sheet repair efforts since then have been rewarded by positive ratings momentum.
Our Investment Outlook
For now, our investment team is biased to add positions on weakness, particularly in industries and issuers that are more insulated from tariffs, as well as in high-quality issuers that have seen widened spreads in sympathy.